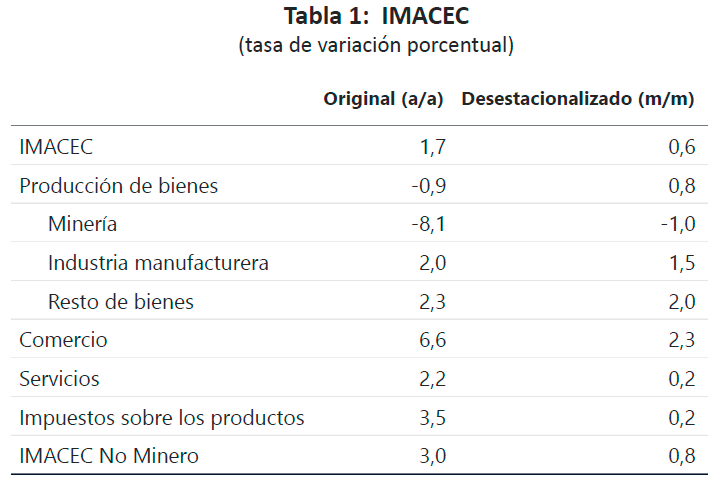
According to preliminary information, las December the Imacec grew 1.7% compared to the same month the year before (Table 1). The seasonally adjusted series rose 0.6% compared to the previous month and 1.3% in twelve months. The month came with the same number of working days as December 2024.
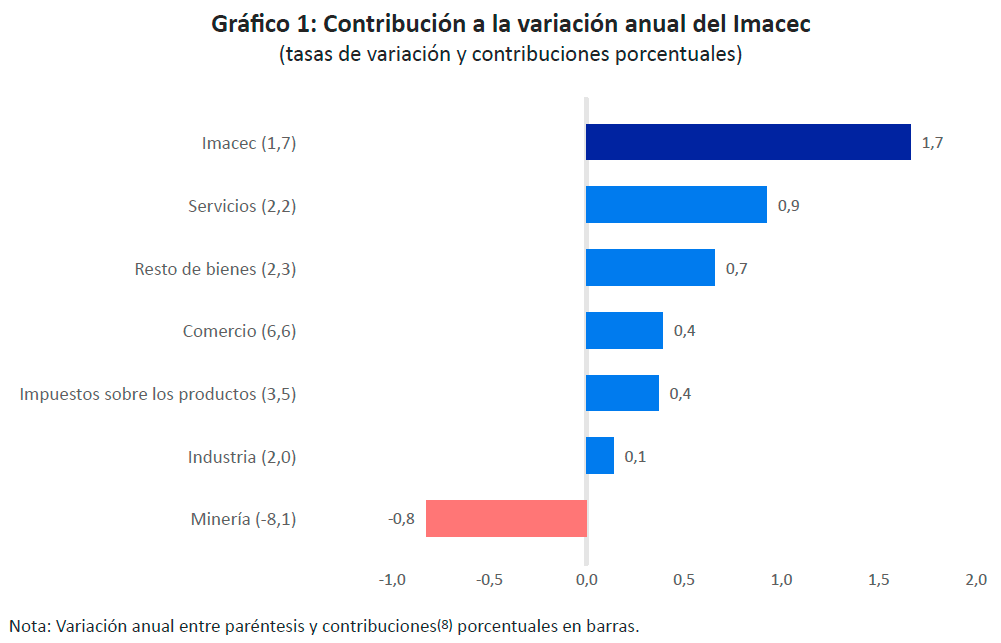
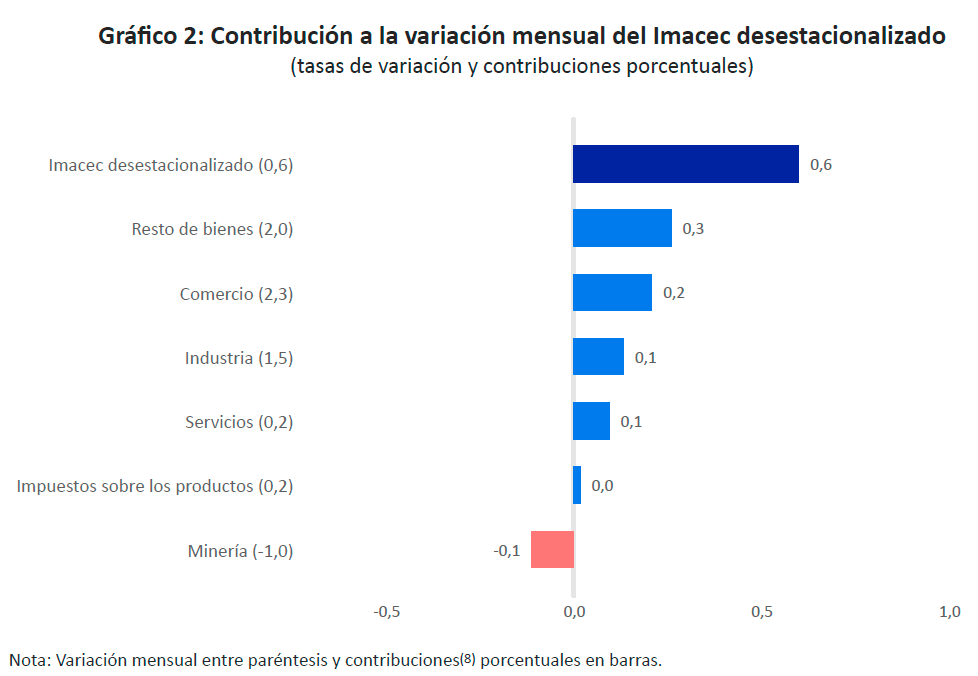
The Imacec result was explained by growth in services and other goods, which was partly offset by lower mining production (Figure 1). Meanwhile, the increase in the deseasonalized Imacec was driven by other goods and trade (Figure 2).
The non-mining Imacec grew by 3.0% annually, while in deseasonalized terms it grew by 0.8% from the previous month and 2.5% over twelve months.

Imacec analysis by activity
1. Goods production
Goods production fell 0.9% annually, a result influenced by lower mining output, particularly copper. This was partly offset by other goods and manufacturing, with respective increases of 2.3% and 2.0%. In other goods, the performance of agriculture and forestry stood out, while food processing drove the results of manufacturing.
In seasonally adjusted terms, goods production increased by 0.8% compared to the previous month, mainly explained by the other goods category.
2. Trade
Commercial activity increased by 6.6% annually. Every component showed positive results, with wholesale trade growth driven by sales of foods and machinery & equipment. The result for the automotive trade was explained by higher vehicle sales, while in the retail sector, sales in specialized clothing stores, grocery stores, and online sales platforms stood out.
The deseasonalized figures showed growth of 2.3% with respect to the previous month, driven by wholesale and automotive trade.
3. Services
Services grew 2.2% in annual terms, mainly explained by the performance of personal services, particularly health care. To a lesser extent, business services also contributed to the grouping's growth.
Seasonally adjusted figures posted growth of 0.2% over the previous month, thanks to the performance of transportation services.
In accordance with the National Accounts figures release schedule, the GDP estimate for 2025, along with revisions to the first, second, and third quarters, will be released on Wednesday, 18 March.


